Congregational intelligence for church leaders
You know your church. Disciplytics helps you see it.
Your church generates signals every week — attendance, participation, giving, care, surveys, and more. Disciplytics brings them together so you can see what's changing, understand what it means, and know where to focus.
No card needed. Read-only Planning Center access. Giving is shown as aggregates, never as donor-level lists.
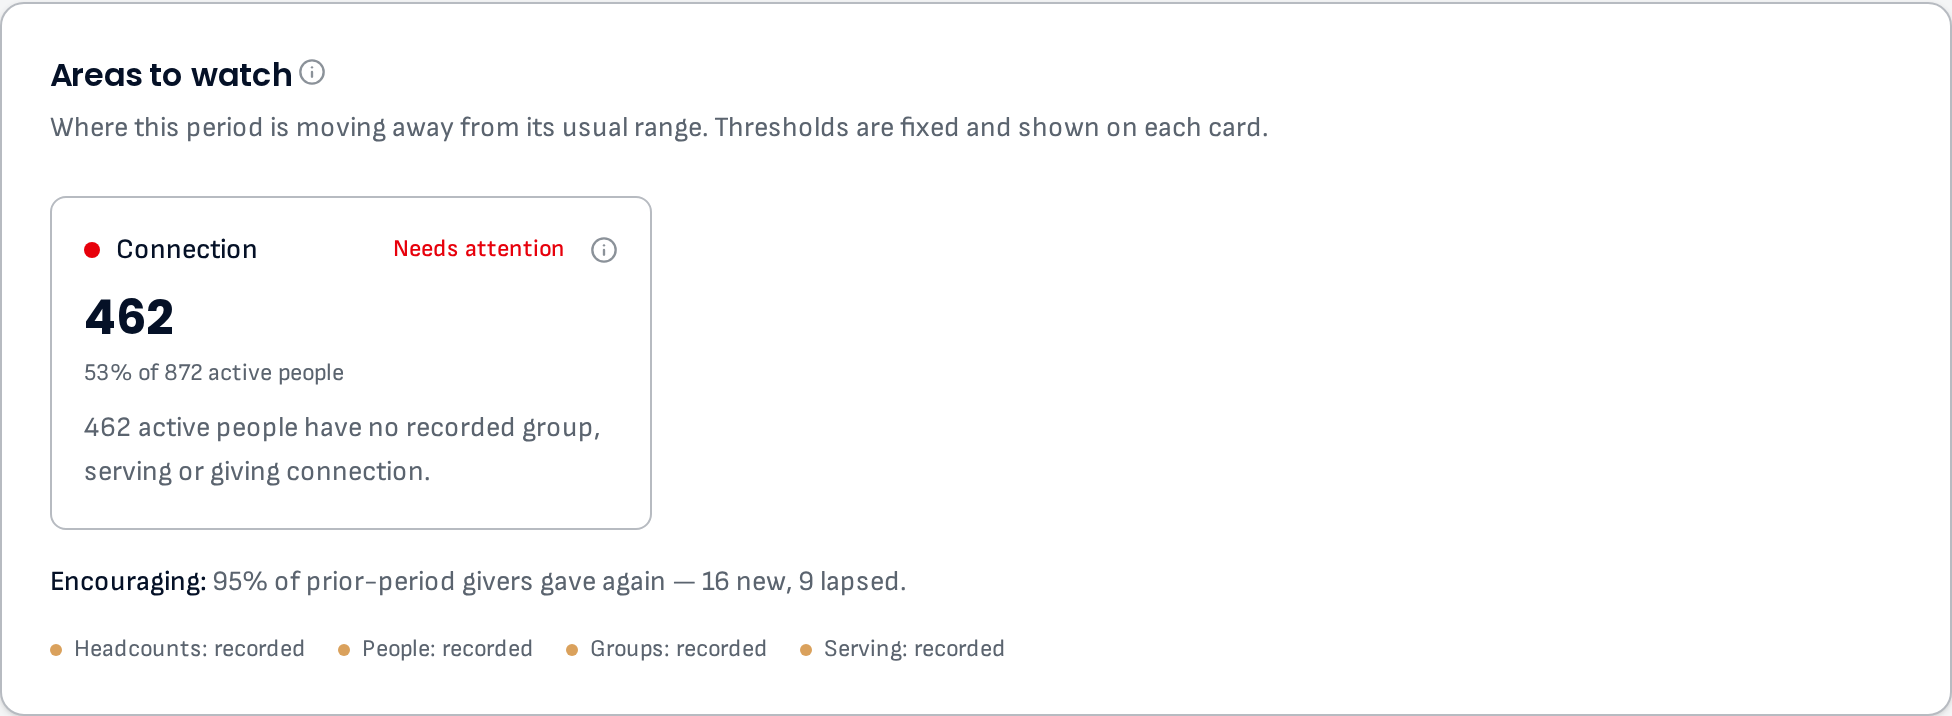
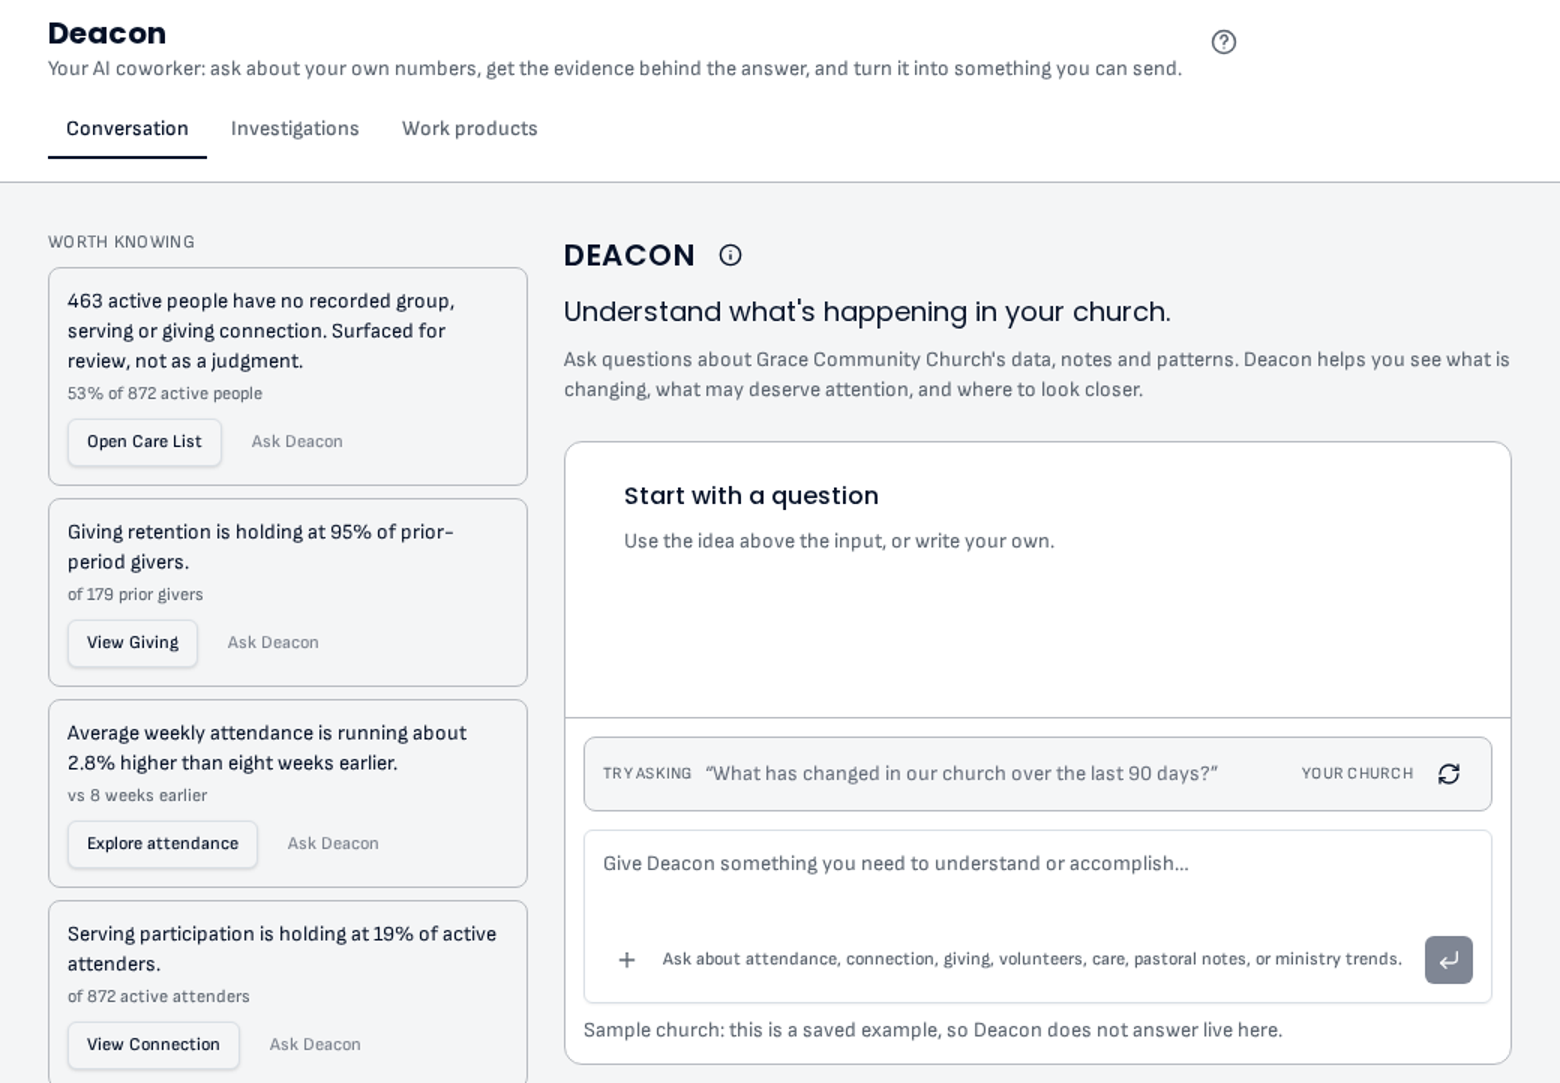
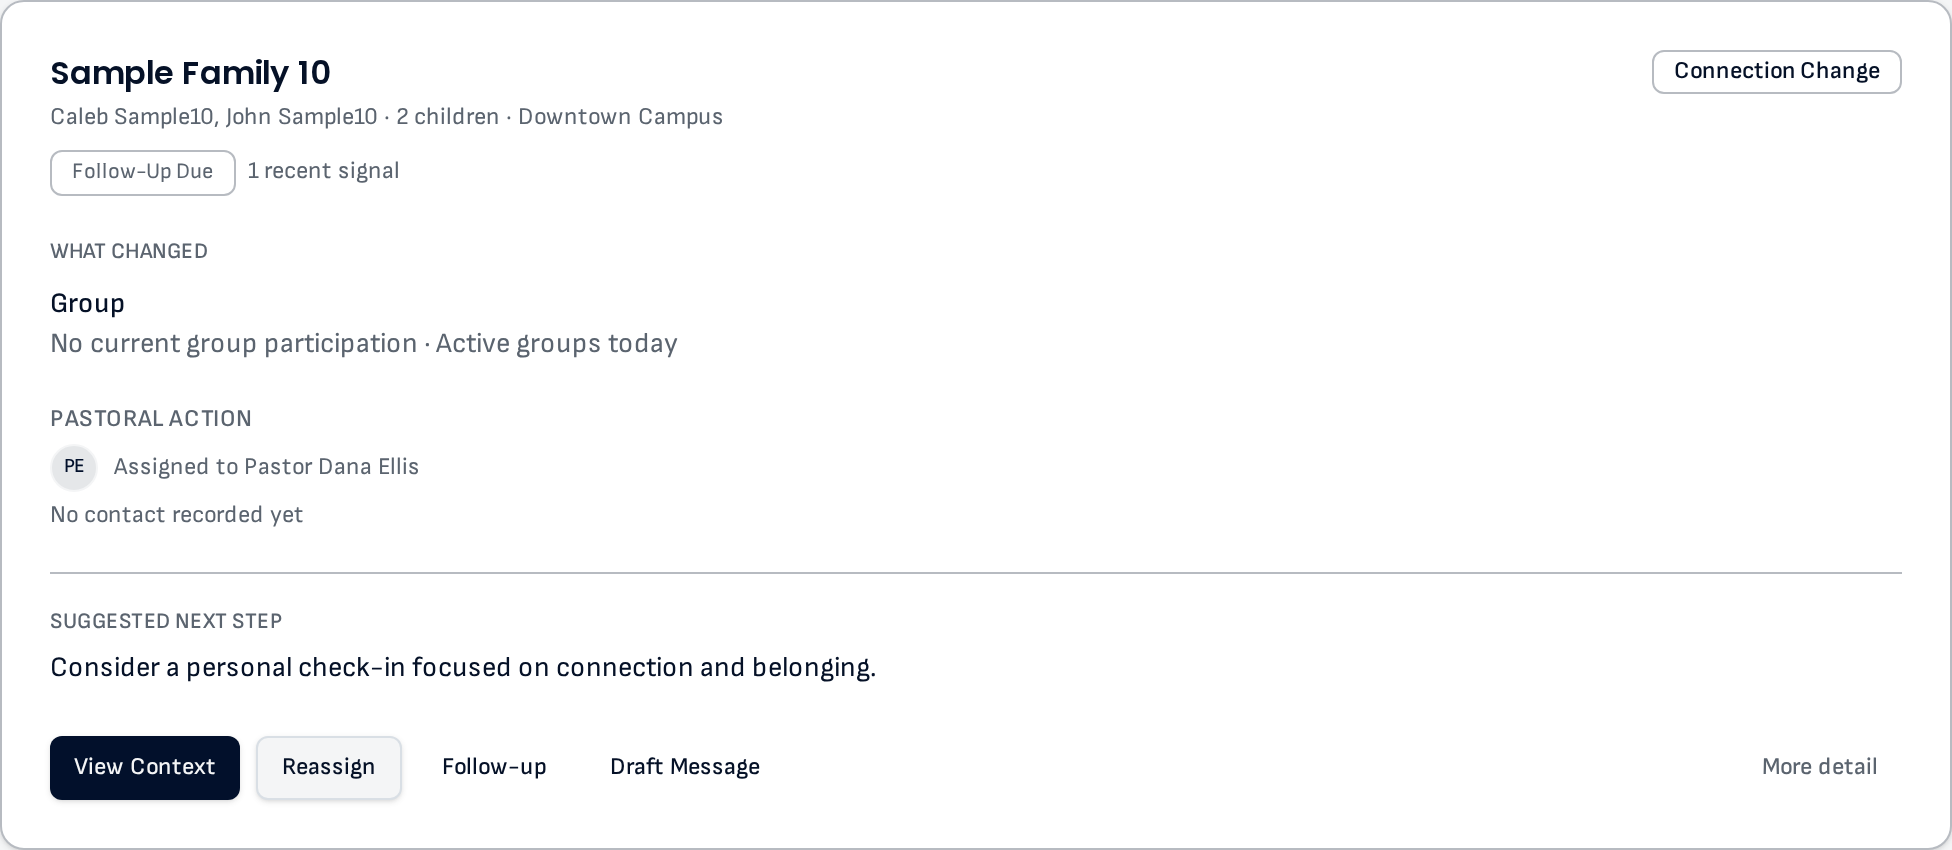
Real Disciplytics screens, shown with sample-church data.
Your church already has the data. The hard part is knowing what to do with it.
Attendance, participation, giving, care and survey answers already exist — spread across systems and reports that rarely speak to each other. Disciplytics brings that information together and helps leaders interpret it.
What's changing?
Who needs attention?
What are people experiencing?
What should we do next?
The rhythm
See what's happening. Learn why. Do something about it.
Congregational learning is a loop, not a report you read once.
- 01
Notice
Bring together the information you're already collecting.
- Attendance
- Participation
- Giving
- Pastoral care
- Surveys
- Community
- 02
Understand
Identify meaningful changes and patterns.
- 03
Listen
When the data doesn't tell you why, ask your congregation.
- 04
Act
Turn insight into pastoral and organizational action.
- 05
Learn
Measure what happened next.
Deacon
Meet Deacon. Your church's analytical coworker.
Deacon investigates your church's data, connects patterns across different areas, identifies what you don't yet know, and helps turn findings into useful work.
Pastor
“What should I know before our elder meeting?”
Deacon
I've found three things worth discussing.
- 1. Newcomer connection has declined
Attendance is relatively stable, but connection among newer households has fallen. - 2. Care workload has increased
Several follow-ups are approaching or beyond their expected window. - 3. Giving is tracking below forecast
Current giving is slightly below the expected year-end trajectory.
Recommended focus
Investigate newcomer connection and review current care workload.
An example of how Deacon answers. In your account every figure comes from your own Planning Center data, and each finding links to the screen it came from.
It shows its work
It produces work you can use
It keeps the thread
Pastoral care
Don't let people fall through the cracks.
Disciplytics surfaces meaningful changes in household patterns so pastors and church leaders can decide where a personal check-in may be appropriate.
- •Attendance changes
- •Connection changes
- •New / recent contacts
- •Multiple changes at once
- •Follow-up that's waiting
- •The pastoral context you have
Disciplytics identifies signals. Pastors interpret the situation. Surface households worth paying attention to, understand what changed, see the context, decide how to respond.
Explore Pastoral carePastoral Listening
Your data can tell you what happened. Your people can tell you why.
Behavioral data is good at identifying the question. A short survey helps you understand the experience behind the pattern — and comparing waves over time turns it into congregational learning.
Observation
Newer households are participating less.
Question
What's preventing newer households from becoming more connected?
Listen
Send a short pulse survey.
Learn
Compare responses by cohort and over time.
Answers are aggregate-only. Individual responses are never viewable, and small groups are suppressed.
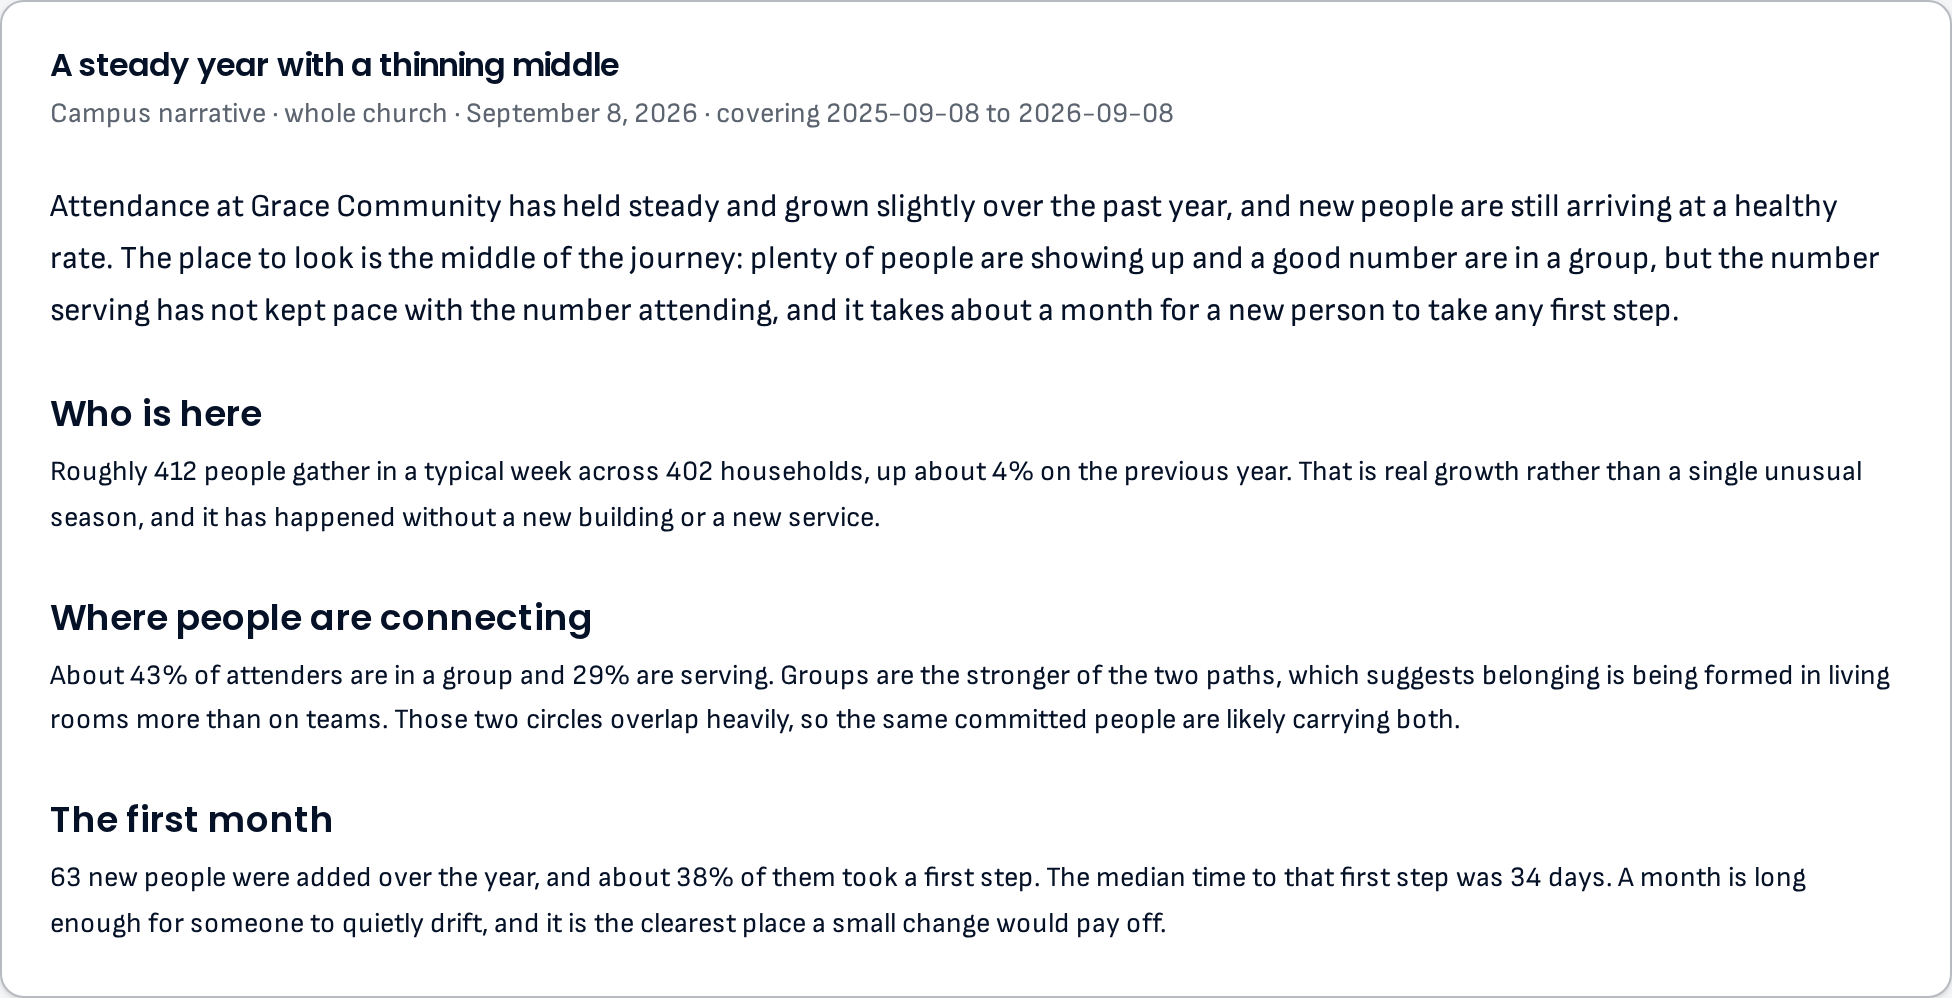
One picture of your congregation.
Explore the details when you want them. Let Deacon help you find them when you don't.
- Overview
- Reports
- Pastoral care
- Discipleship
- Listening
- Deacon
These aren't disconnected features. They're one system.
Each part feeds the next, and what you learn comes back around.
Data
Planning Center · Surveys · Community data
Understand
Overview · Reports · Deacon
Learn
Pastoral Listening
Act
Pastoral care · Discipleship · Work products
Evaluate
Trends · Surveys · Longitudinal analysis
Built for pastoral judgment, not automated judgment.
Your data stays yours
Signals aren't diagnoses
People aren't metrics
Giving amounts are only ever shown as aggregates — no donor-level giving lists anywhere. The one screen that names people is the care list, built for pastoral follow-up and showing no amounts.
Pay what your church can
Every amount unlocks every feature. Start with a free 7-day trial — no card needed.
$50 / mo
One campus, getting started
$150 / mo
Growing church, whole team
$250 / mo
Multi-campus, heavy use
Custom
Name your own amount, from $25
Free snapshot
See what Disciplytics can uncover in your church.
Get a snapshot of meaningful trends, areas to watch, and opportunities to learn more about your congregation.
No sales call required. Every new account can look around a sample church first.
You don't need more church data. You need to understand the data you already have.
Disciplytics helps church leaders see what is happening, listen to their congregation, and act with greater clarity.
Get Your Free Congregational Snapshot